So, I’ve been thinking about how to account for clustering of creatures in simulating population dynamics, for example in the auto-evo algorithm. The concept I’ve found myself attracted to to handle this is auto- and crosscorrelation of population densities. Essentially, a one-dimensional autocorrelation is a function of x given by integrating (adding up, in the discreet case) the product of the densities with a version of those densities offset by x. In the case of a clustered population, the autocorrelation at low x will be higher than at higher x, because the peaks will meet each other better. Crosscorrelation is a similar measure between the densities of two different species.
The goal would be to simulate the dynamics of the auto- and crosscorrelations of all species being considered directly, allowing consideration of clustering without having to simulate the distributions of species in space, and saving computing power. I’m still working on that component. What I have made more progress on is translating auto- and crosscorrelations back into a spacial distribution for level generation purposes. (Translating from population density is trivial)
I got the basic idea from this paper on signal processing. It describes the process for dimensions higher than 1, but I’ve focused on the most basic case so far. Essentially, it translates the problem of finding a signal (population distribution, in our case) that has a certain cross- and autocorrelation into the problem of finding a matrix with certain characteristics that when multiplied with other certain matrices gives a particular set of traces, and then attacks that problem with a technique called semi-definite programming. Don’t worry, I’m going to gloss over those technical details.
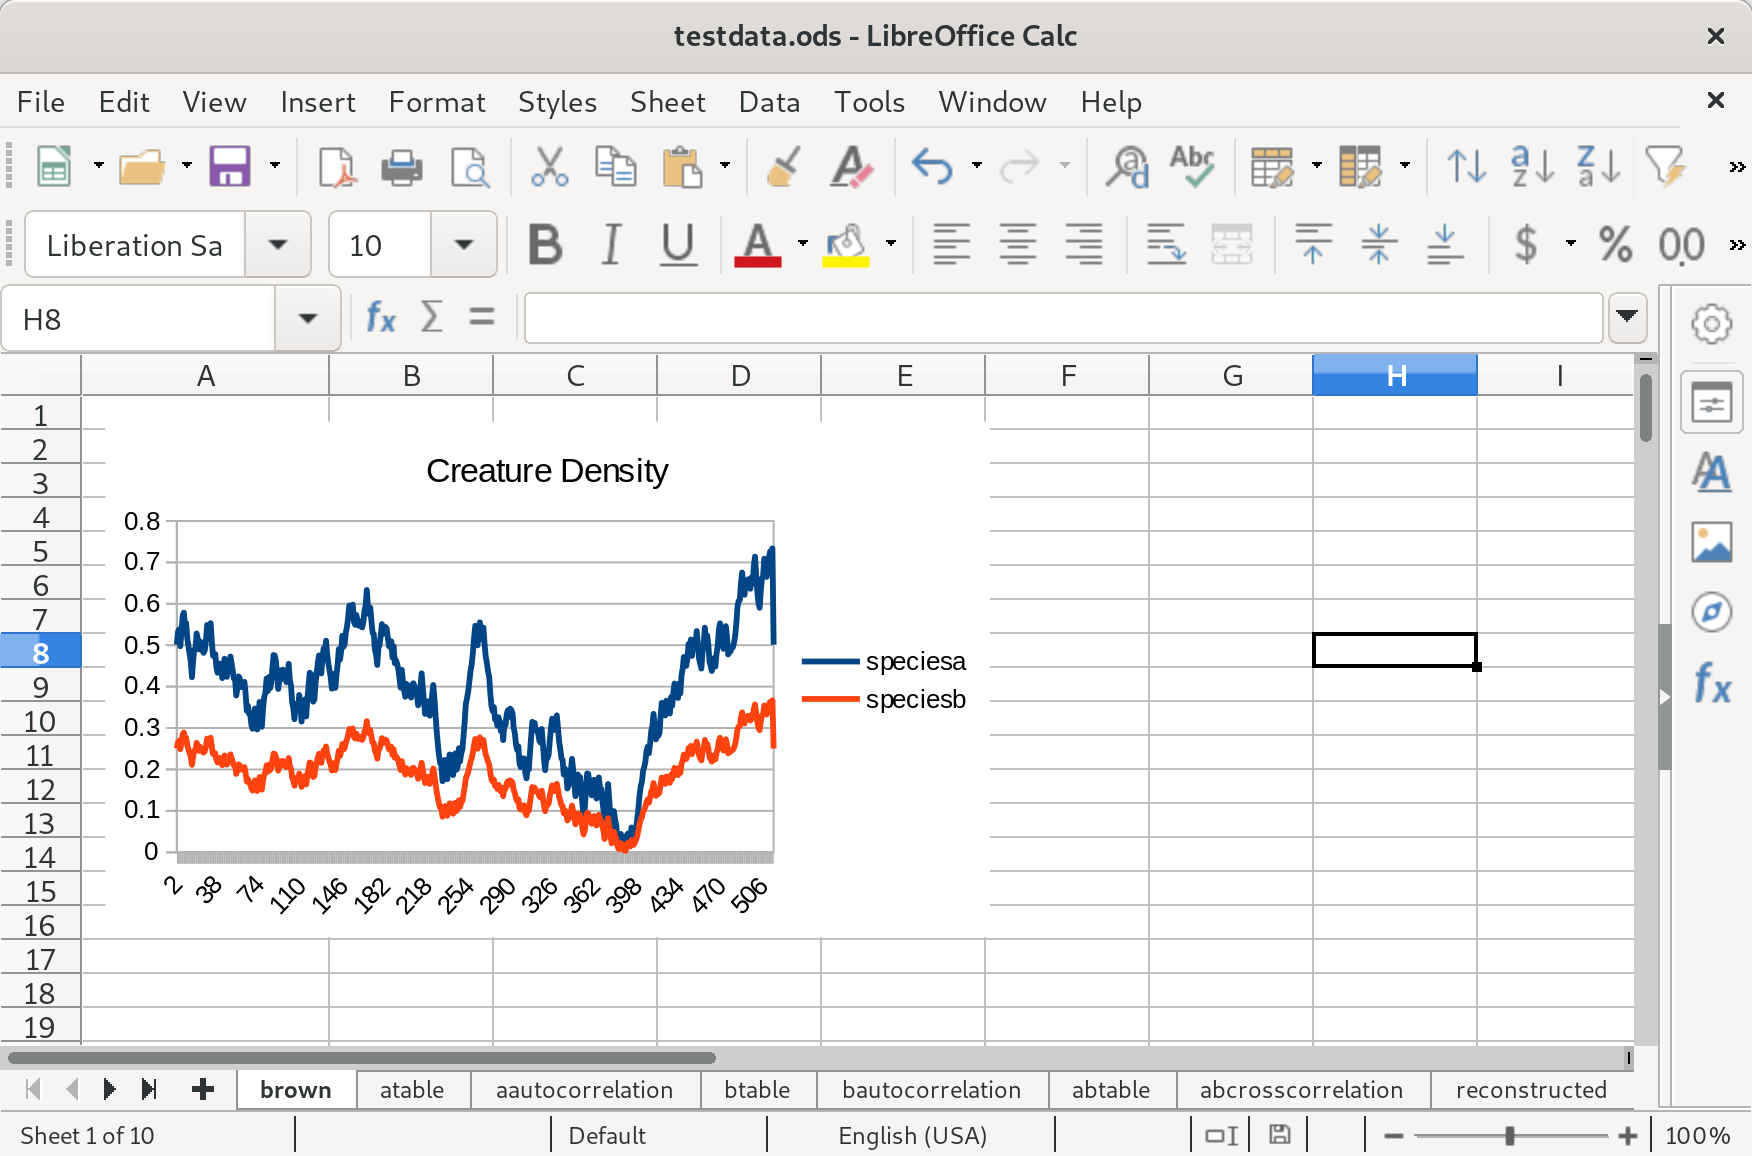
So, without further ado, the meat of this post. I generated some brownian noise to serve as the input population density, and moved it into a spreadsheet. Species A has a distribution equal to that brownian noise plus a constant to ensure it’s positive everywhere, and species B has half the density of species A at every point.
Next, I calculated the autocorrelation of species A:

Then species B:
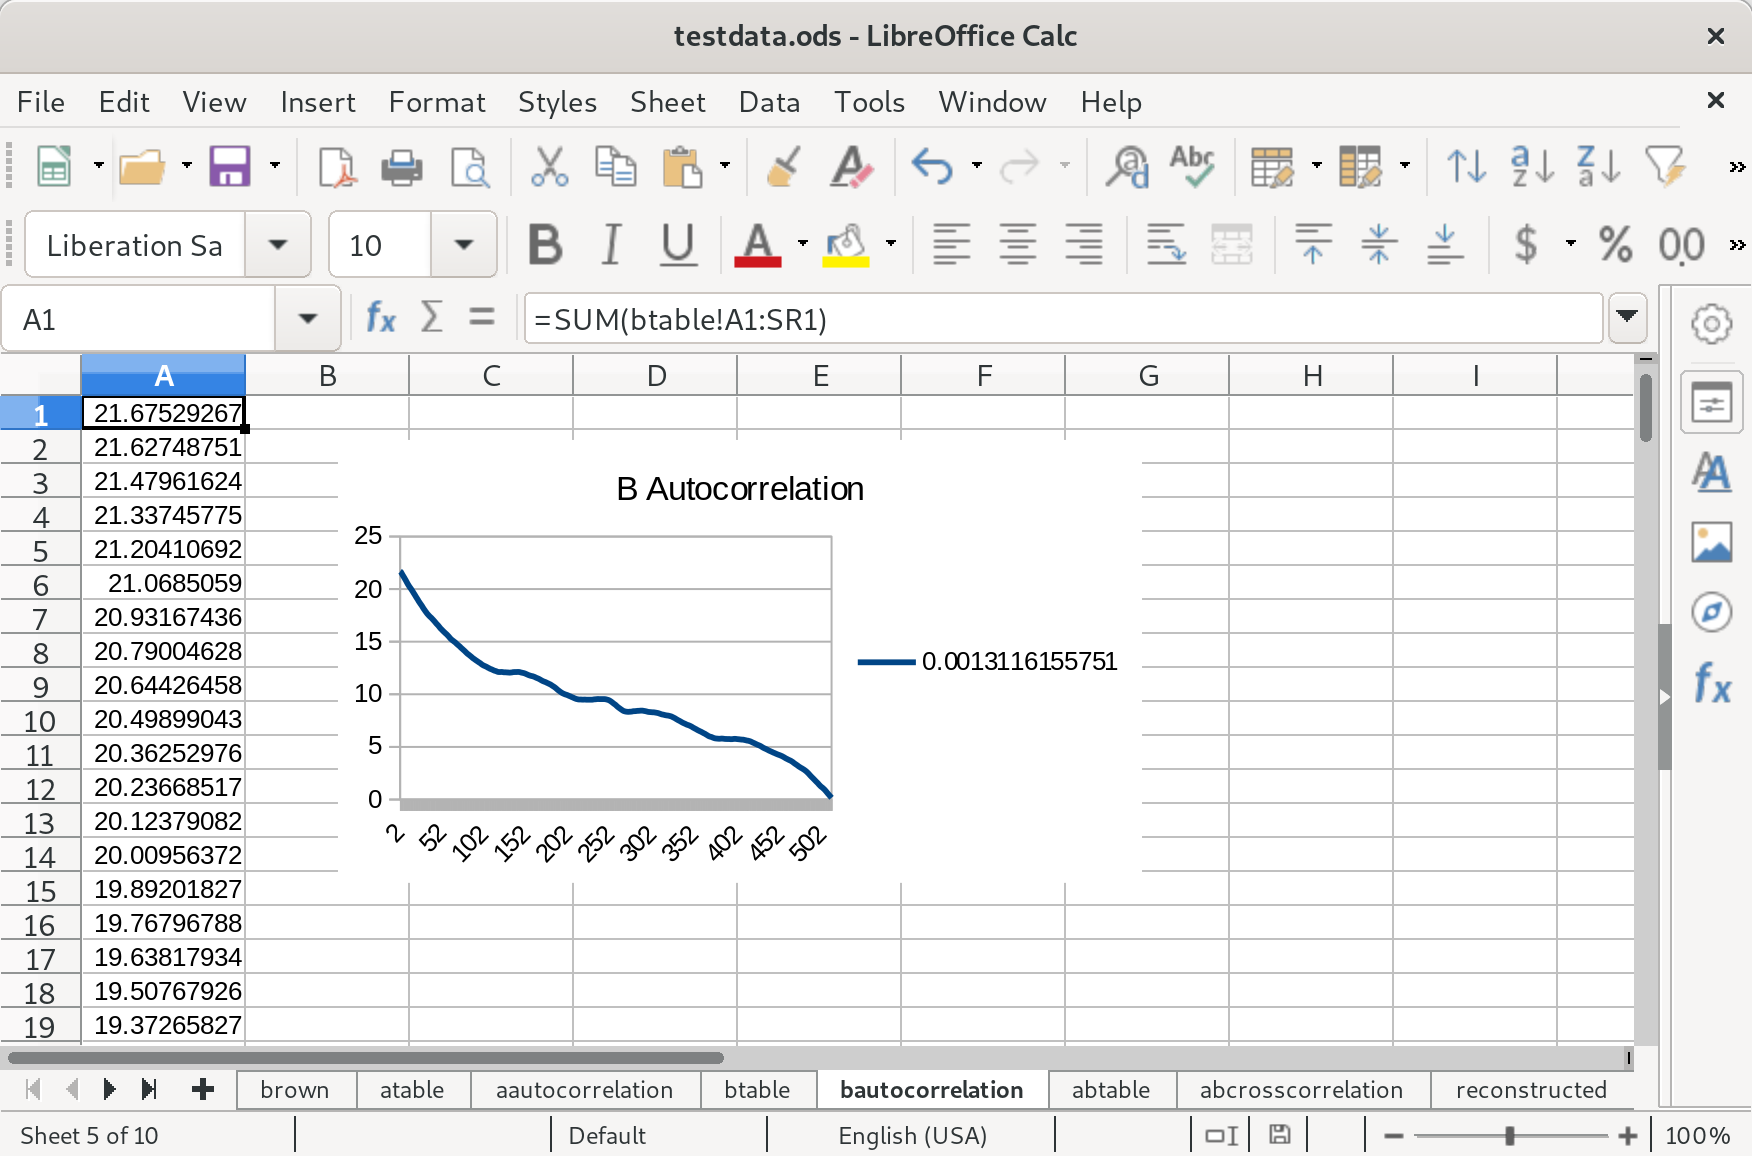
You might notice these are very similar. That’s because the distributions of the two species only differs by a constant factor. Next, I calculated the cross-correlation of these two species’ distributions:

Again because of the similarity between the two species, this function is symmetrical, and each half resembles the autocorrelation of one of the them. Next, I took the data out of the spreadsheet and processed it into a SDPA file that could be solved by an open source semi-definite programming algorithm called CSDP. The source I used to do this (in Haskell) is available on request. It took about 450 seconds on my machine to find a solution, but I hadn’t optimized my linear algebra libraries, and that would apparently knock off the zero all on its own. Each density distribution is 512 floating point numbers long. Here’s the solution put back into the spreadsheet:
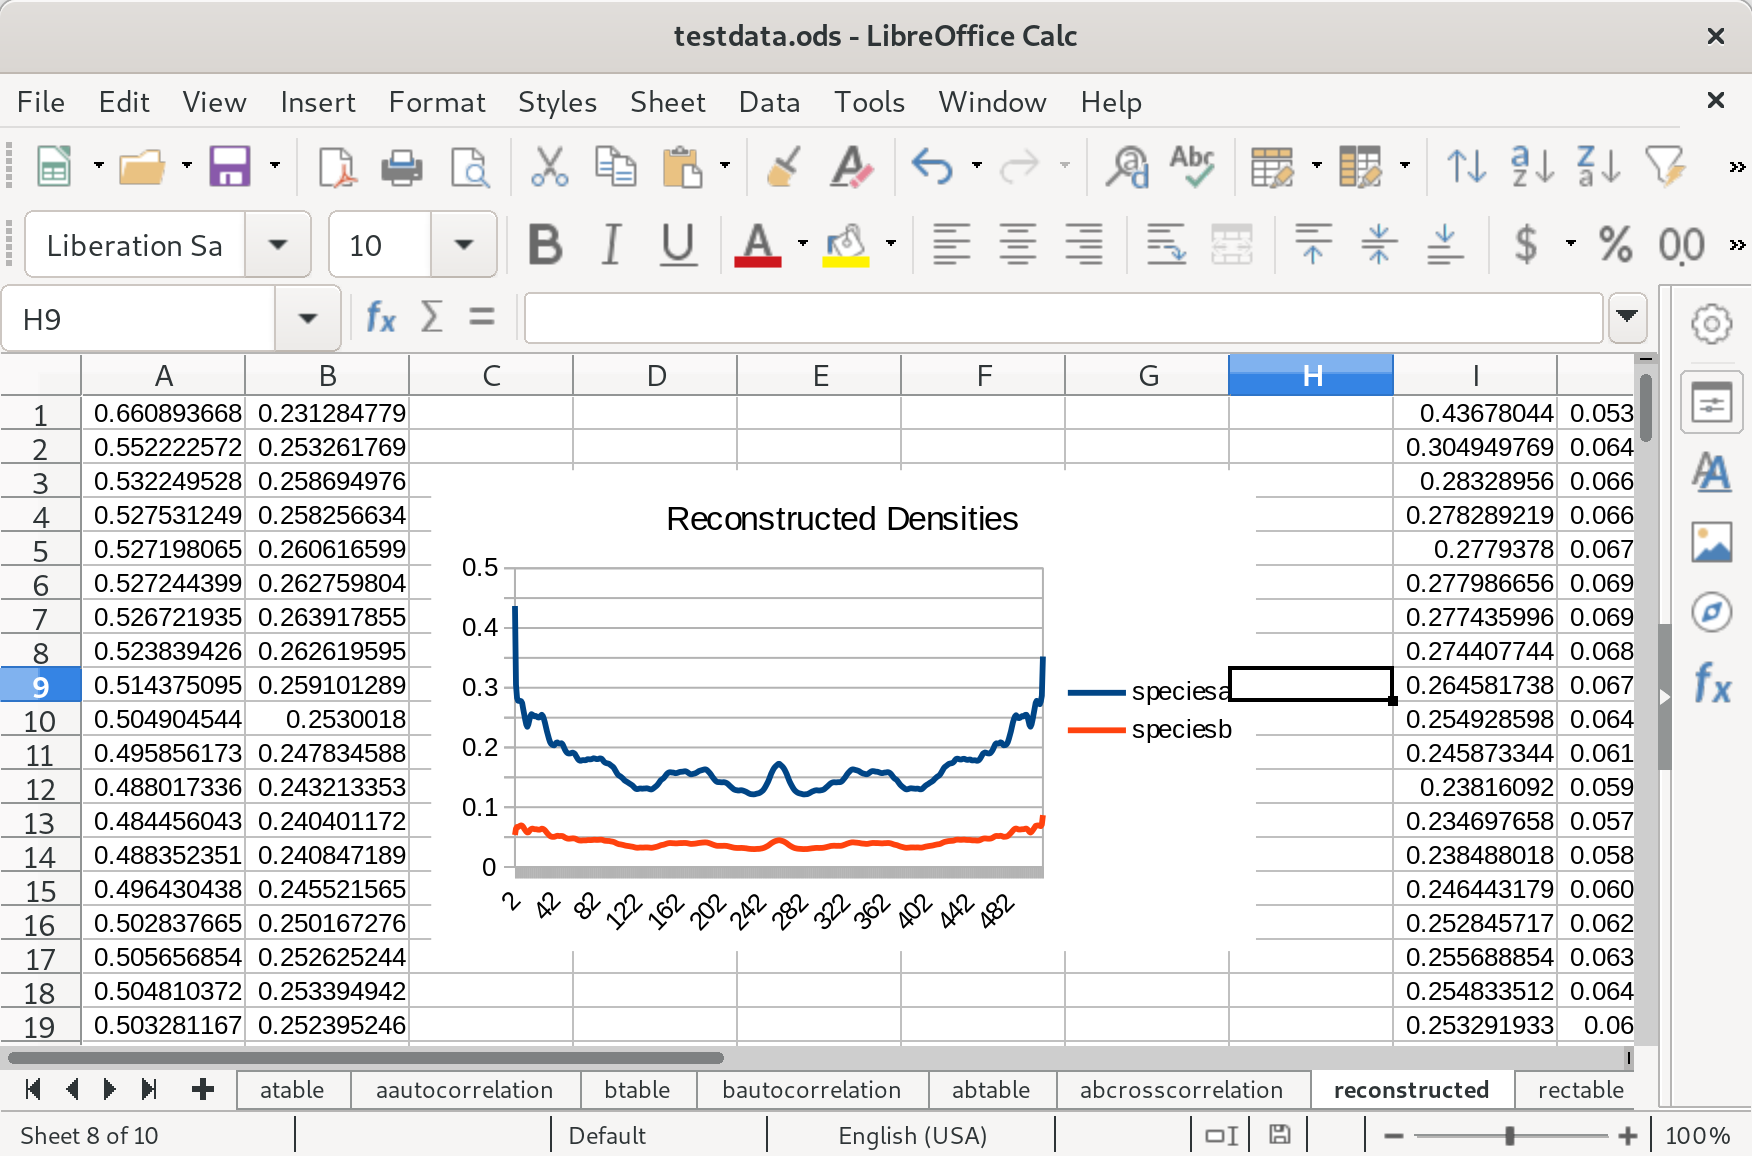
I have a hunch that I could get rid of the symmetry here by picking a randomized starting point for the algorithm. Encouragingly the difference in scale between the two species seems to be preserved. Now to calculate an autocorrelation (only one is required, because as we’ve seen they all are quite similar):
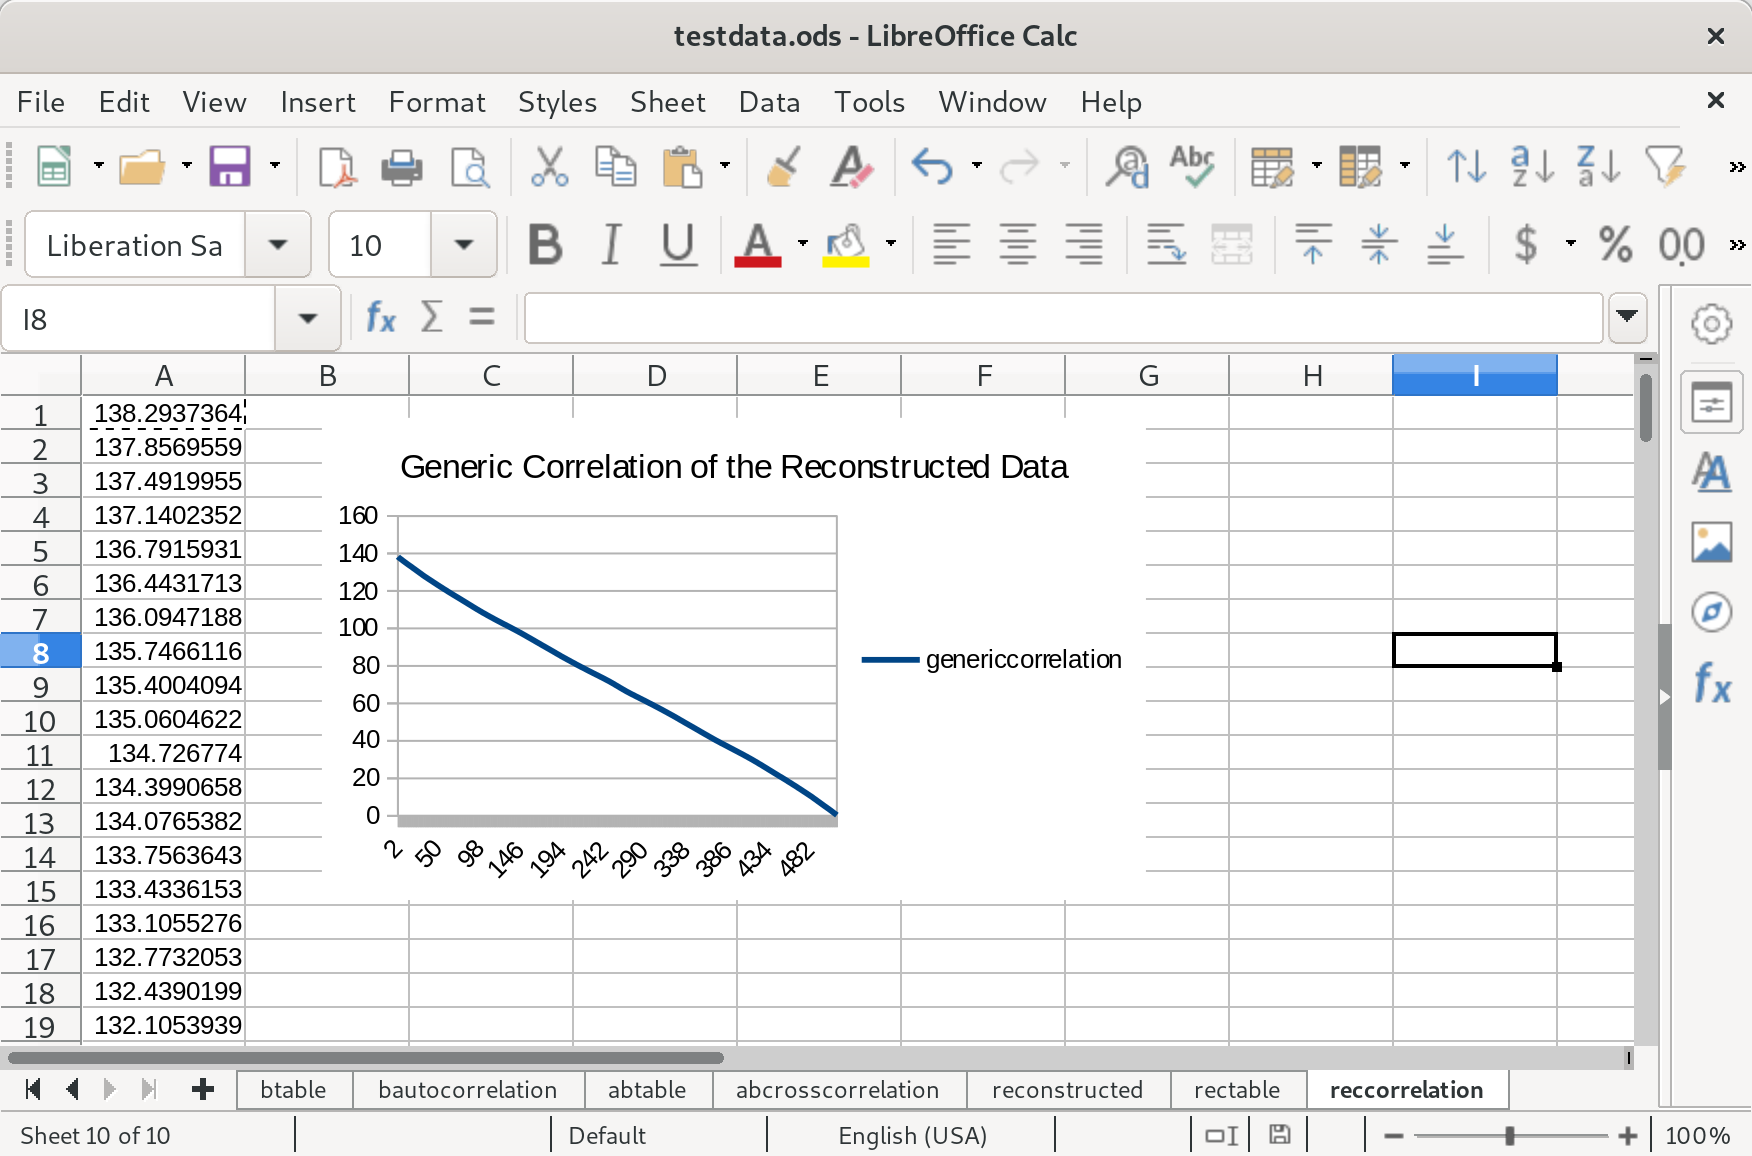
It needs work. The overall trend is accurate, but I’d like to see the bumps recreated. I decided to post this anyway because I’ve made an encouraging amount of progress so far. I don’t know, does anyone have any thoughts?
